
Description
You already know which product sold out last month. What you do not know is how much money is sitting on your shelves right now, which five items are about to run out, and what the stock you are holding actually cost you. This workbook answers all three, on one screen, without you doing any maths.
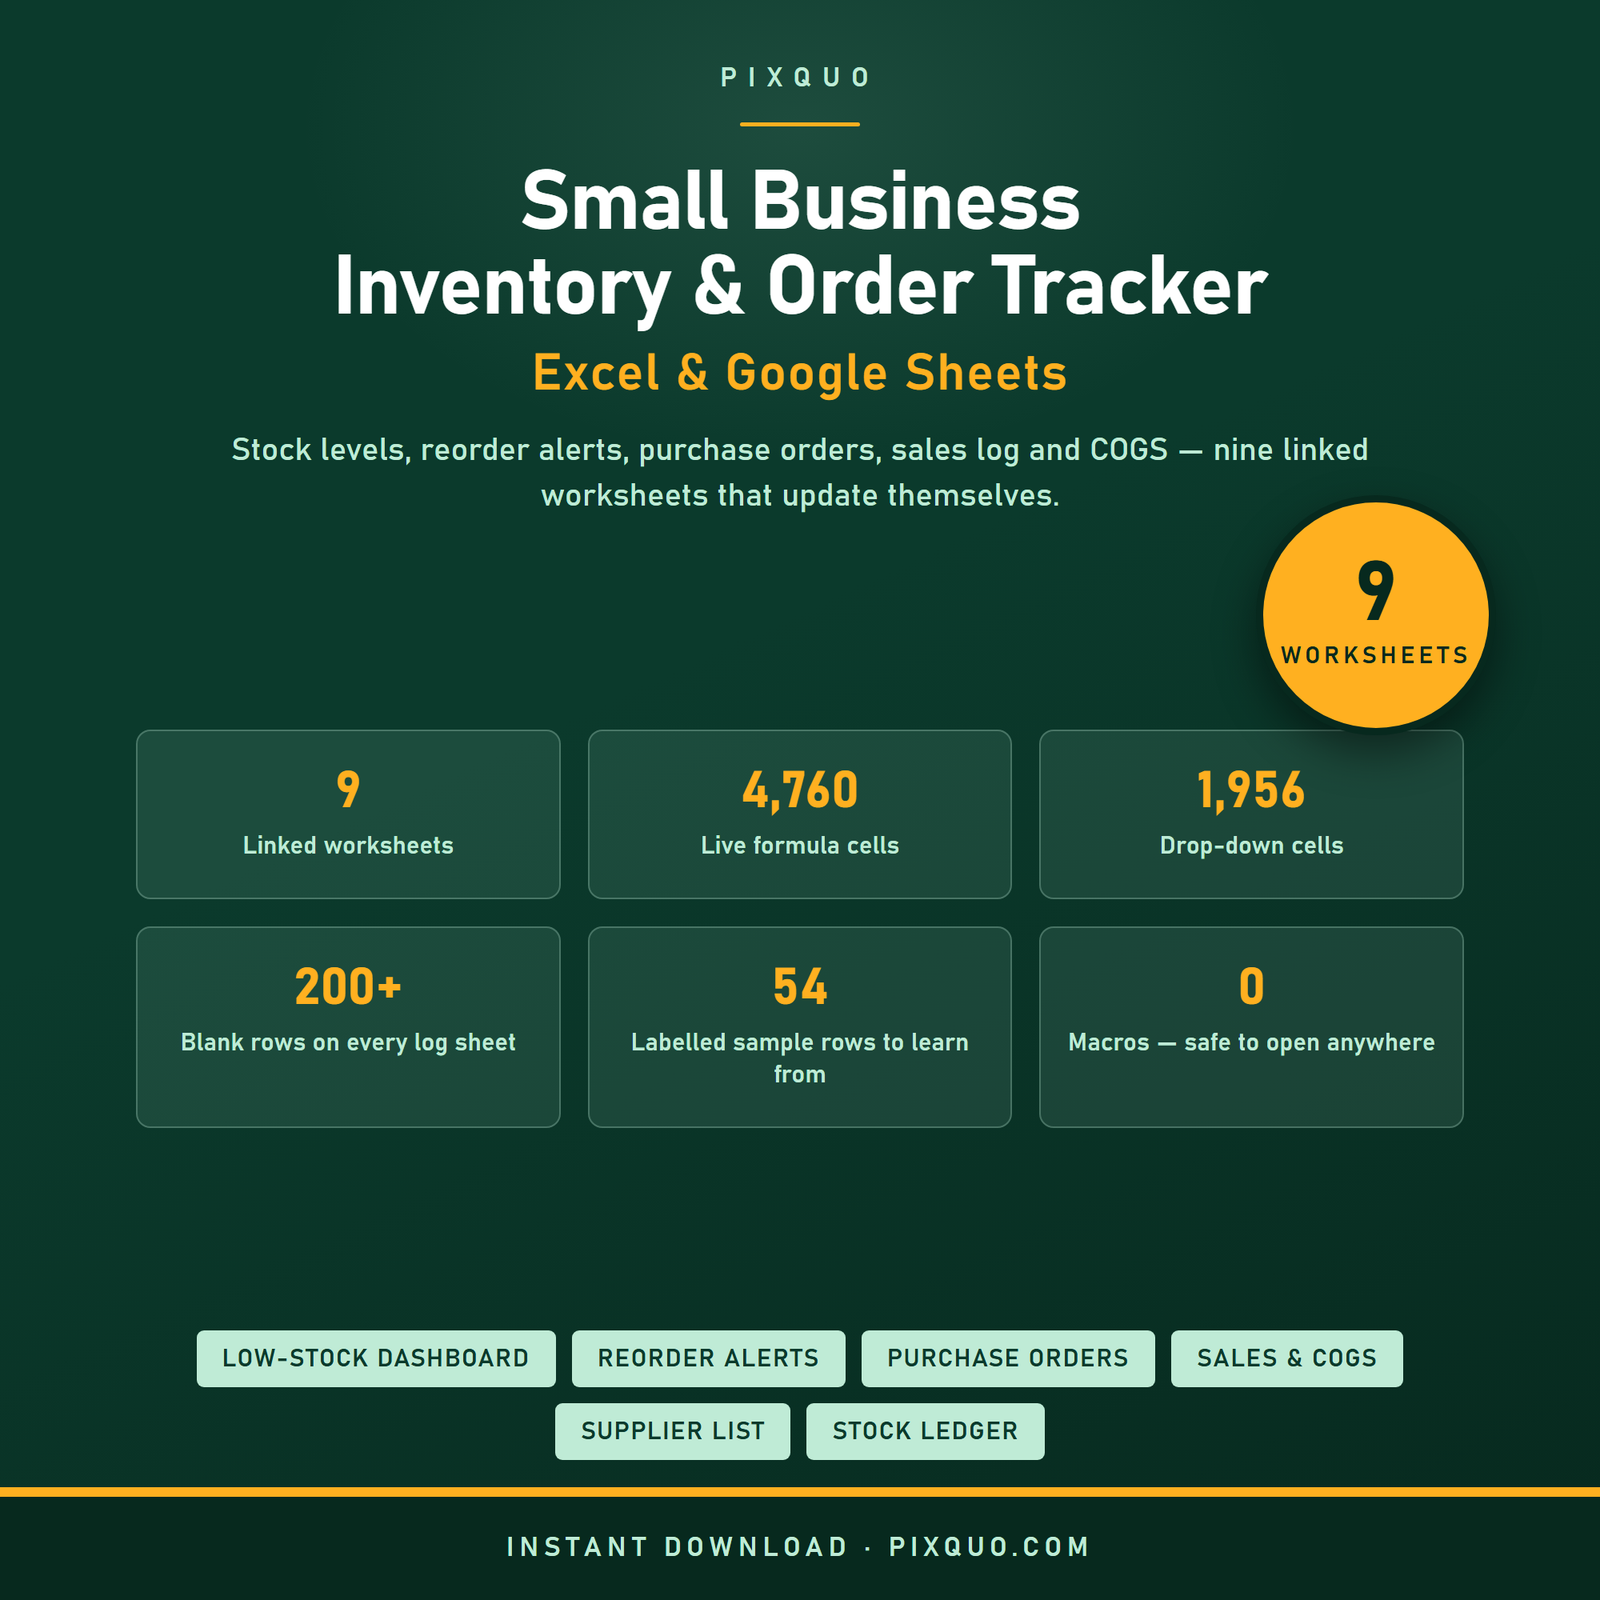
The Small Business Inventory & Order Tracker is a nine-sheet spreadsheet template for anyone who buys stock, holds stock and sells stock. Products, suppliers, purchase orders, sales and stock movements all live in one file and feed a single dashboard. You type what happened. The formulas do the rest.
It opens in Microsoft Excel and imports cleanly into Google Sheets. There are no macros, no add-ons, no subscriptions, and nothing to install.
What is inside — all nine worksheets
1. START HERE. A plain-English walkthrough of how the nine sheets connect, a five-step set-up sequence, a colour legend explaining what every shade in the workbook means, and the Google Sheets import instructions. Two minutes of reading and you know where everything lives.
2. Dashboard. The read-only summary you will actually check. It counts how many items are OUT of stock, how many are LOW, how many are OK, and how many need reordering right now. It totals your inventory value at cost, your inventory value at retail, and the gross profit sitting in that stock. It shows units sold, revenue, COGS, gross profit and gross margin for the period you set. It counts your open purchase order lines and the value still outstanding with suppliers. Below that sit two live tables: a low-stock reorder list that automatically pulls the fifteen items at or below their reorder point — with supplier, live quantity, reorder point and reorder quantity ready to copy into an email — and a top ten items by stock value table showing exactly where your cash is tied up. Every figure is a formula. You never type on this sheet.
3. Products. Your master SKU list. Enter SKU, item name, category, supplier, unit cost, retail price, your counted quantity, reorder point and reorder quantity. The sheet then calculates the net of every stock movement, your live quantity on hand, a colour-coded stock status (red OUT, amber LOW, green OK), stock value at cost, stock value at retail, and margin percentage per item. Category and supplier are drop-downs, so spelling stays consistent and your totals never split across “Homeware” and “Home ware”.
4. Suppliers. Contact name, email, phone, lead time in days, payment terms, minimum order value and free-text notes for every business you buy from. Two extra columns calculate themselves: how many of your SKUs each supplier provides, and the total value you currently have outstanding on order with them. Supplier names typed here become the drop-down options on Products and Purchase Orders.
5. Purchase Orders. One row per order line. PO number, order date, supplier, SKU, quantity ordered, unit cost, expected date, status and quantity received. The item name is looked up from Products, and line total, quantity outstanding and value outstanding all calculate. Status is a drop-down — Draft, Ordered, Partially Received, Received, Back-ordered, Cancelled — and the status cell colours itself so a half-received order is impossible to miss.
6. Sales Log. One row per sale line. Enter date, SKU, quantity, unit price and sales channel. The sheet fills in the item name, calculates revenue, looks up the unit cost from Products, then calculates COGS, gross profit and margin percentage for that line. Channel is a drop-down so you can filter retail against online against wholesale in one click.
7. COGS Calculator. Set two dates and get your cost of goods sold two different ways. Method one is the classic inventory calculation: opening inventory plus purchases received minus closing inventory. Method two rolls up the COGS column from your Sales Log. The sheet shows both plus the difference between them, which is a useful early warning about shrinkage, breakage or uncounted stock. Underneath sits a per-SKU table showing units sold, revenue, COGS, gross profit and margin for each of your first forty products, with a total row.
8. Stock Movements. The stock ledger, and the sheet that keeps your quantities honest. Every receipt, sale, breakage, customer return and stock-count correction is one row with a plus or minus quantity and a movement type drop-down. The sheet looks up the item name, values the movement at cost, and shows a running balance for that SKU. Products adds these up to give you the live quantity on hand.
9. Settings. The source lists behind every drop-down in the file — categories, sales channels, PO statuses, payment terms and movement types. Change a list here and the drop-downs update everywhere. This is what makes the workbook yours rather than someone else’s idea of your business.
Who this is for
It is built for the size of business where a warehouse system is overkill and a notebook has stopped working. Independent retail shops. Etsy, eBay, Shopify and Amazon sellers. Market stall and craft fair traders. Makers who buy components and sell finished goods. Cafés and delis tracking dry goods and packaging. Salons and clinics tracking retail products. Print-on-demand and dropship sellers who still hold some stock. Anyone running a side business who wants to know their real margin before they price the next batch.
It works just as well for one hundred SKUs as for ten, and every log sheet ships with around two hundred pre-formatted, formula-ready blank rows so you are not fighting the file on day one.
How to use it
Open START HERE. On Settings, swap the sample categories and channels for your own. On Suppliers, delete the sample rows and type your real suppliers. On Products, delete the sample rows and enter your SKUs, cost, retail price, counted quantity and a reorder point for each. That is the whole set-up.
From then on the routine is small: log stock changes on Stock Movements, sales on Sales Log, orders on Purchase Orders. Glance at the Dashboard before you place an order. At month end or quarter end, set the two period dates on COGS Calculator and read off your COGS and gross margin.
Fifty-four rows of clearly labelled sample data — a small homeware shop with twelve SKUs, ten suppliers, eight purchase order lines, twelve sales and twelve stock movements — are already in the file so you can see every formula working before you commit. Each one is tagged “SAMPLE — delete this row”.
Formats and compatibility
You get one .xlsx workbook plus a short set-up text file, delivered as an instant download. It works in Excel 2016 and later, Microsoft 365, Excel for Mac and Excel on the web. For Google Sheets, open a blank sheet, choose File > Import > Upload, select the file and pick “Replace spreadsheet”. Formulas, drop-downs, conditional colours, currency formats, frozen headers and filter buttons all carry across — nothing in the file uses an Excel-only function. Currency is formatted in dollars by default and takes ten seconds to change to yours; no formula edits needed. There are no macros, so no security warnings.
Pairs well with
- Small Business Bookkeeping & Tax Spreadsheet — income, expenses, invoices and mileage with a profit and loss dashboard, so the COGS figure from this tracker has somewhere to go.
- Etsy & Online Seller Profit Calculator — work out the true margin on a listing after platform fees, shipping and payment processing before you set the price.
- Small Business Planner (Printable) — the off-screen half: goals, marketing plan and weekly focus pages for the business you are stocking.
Two free guides worth reading alongside it: Digital Product & Side Hustle Ideas and Budgeting & Saving Money.
Questions people ask before buying
Do I need Excel to use this?
No. Google Sheets is free and imports the file in about thirty seconds — the README included in the download walks you through it. Every formula was chosen to work identically in both programs, so nothing breaks on import.
How does it know my stock level?
You enter a counted opening quantity per SKU on the Products sheet. After that, every plus or minus you log on the Stock Movements sheet is added up automatically, so the live quantity, stock status, stock value and reorder alerts always reflect what you have logged.
Can I add more rows, or more products?
Yes. Each log sheet has roughly two hundred pre-formatted rows ready to go. To add more, copy the last formatted row and paste it down — that carries the formulas, formats and drop-downs with it. If you extend well beyond the built-in range, widen the ranges in the Dashboard and COGS Calculator summary formulas to match.
Can I change the categories, channels and statuses?
That is what the Settings sheet is for. Rewrite the lists there and every drop-down in the workbook updates. You are not stuck with anyone else’s category names.
Is this accounting software?
No, and it does not pretend to be. It is a spreadsheet template for tracking stock, orders, sales and cost of goods sold. It is not accounting, tax or financial advice — check any figure you plan to file with your own accountant or bookkeeper.
Instant download and licence
The file is available to download immediately after checkout — nothing is posted, and nothing arrives in the mail. Because it is a digital product delivered instantly, the sale is final and no refunds are offered once the download has been accessed.
© pixquo.com. Licensed for personal use and for use inside one business you own or work for. You may not resell, share, redistribute, sublicense or republish the file or its contents, in whole or in part, edited or unedited.
Explore More Digital Tools
- Browse the full shop — planners, trackers, prompt packs and printables
- Free printables library
- Budgeting & saving guide · Planners & productivity guide
- Paper sizes & currency by country
Every Pixquo product is an instant download — no shipping, no waiting.

Reviews
There are no reviews yet.