
Description
Find out what each listing actually leaves you — before you price it
You priced a product at $24. It felt right. Then the platform took its listing fee, its transaction cut and its payment processing slice. Then the postage was $1.20 more than you charged. Then you remembered the packaging, the ad spend, and the forty minutes you spent making it. What’s actually left? Most sellers don’t know, and the ones who find out usually find out at the end of the year, from an accountant.
The Etsy & Online Seller Profit Calculator does that arithmetic for you — per listing, per platform, per month. You type the white cells; every total, margin, flag and dashboard tile is a live formula. It opens in Microsoft Excel and imports cleanly into Google Sheets. No subscription, no login, no app.
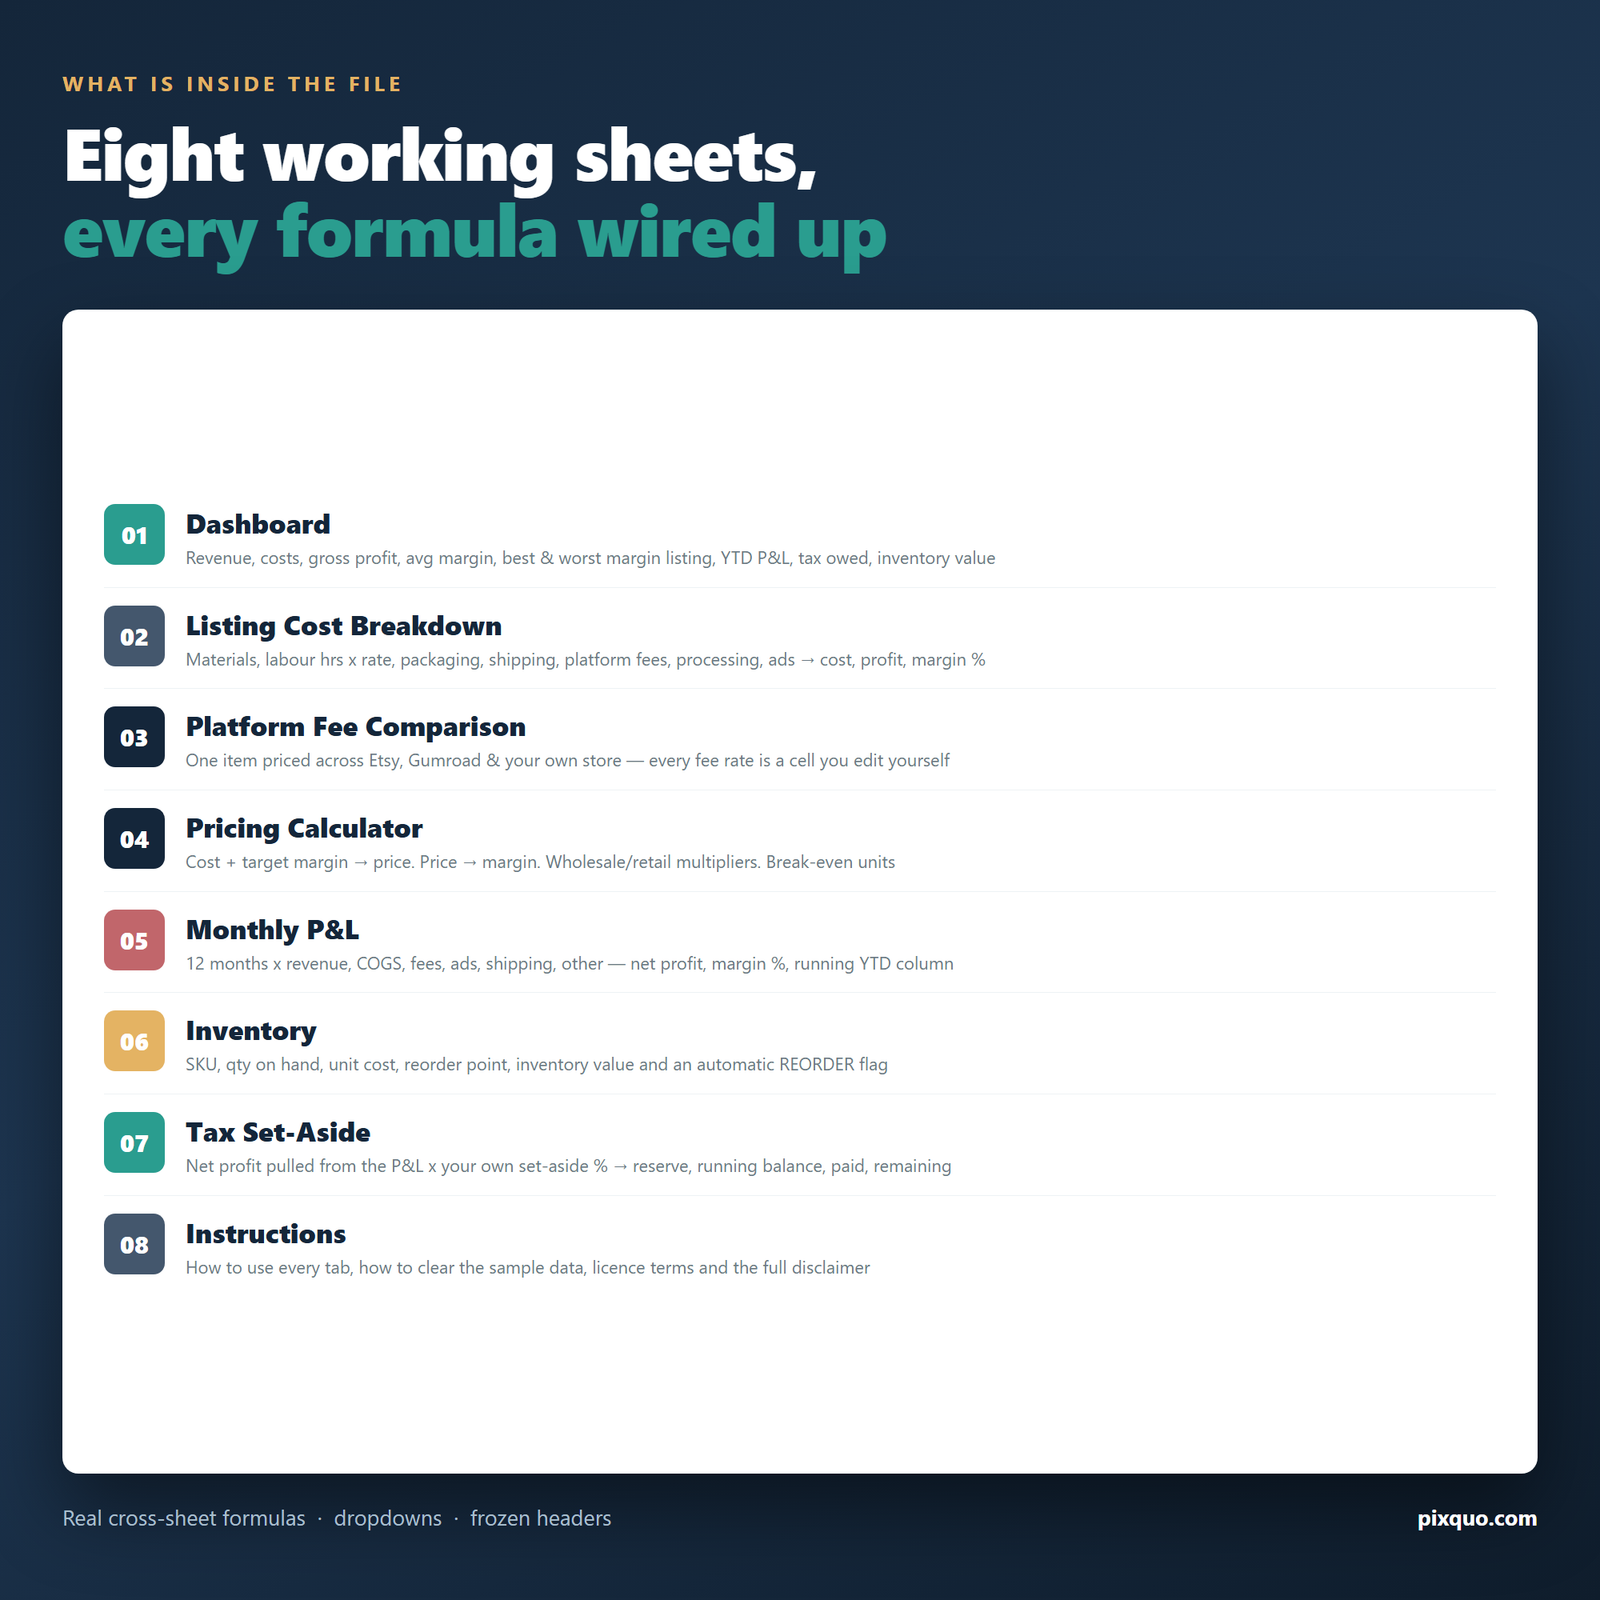
What’s inside — all eight sheets
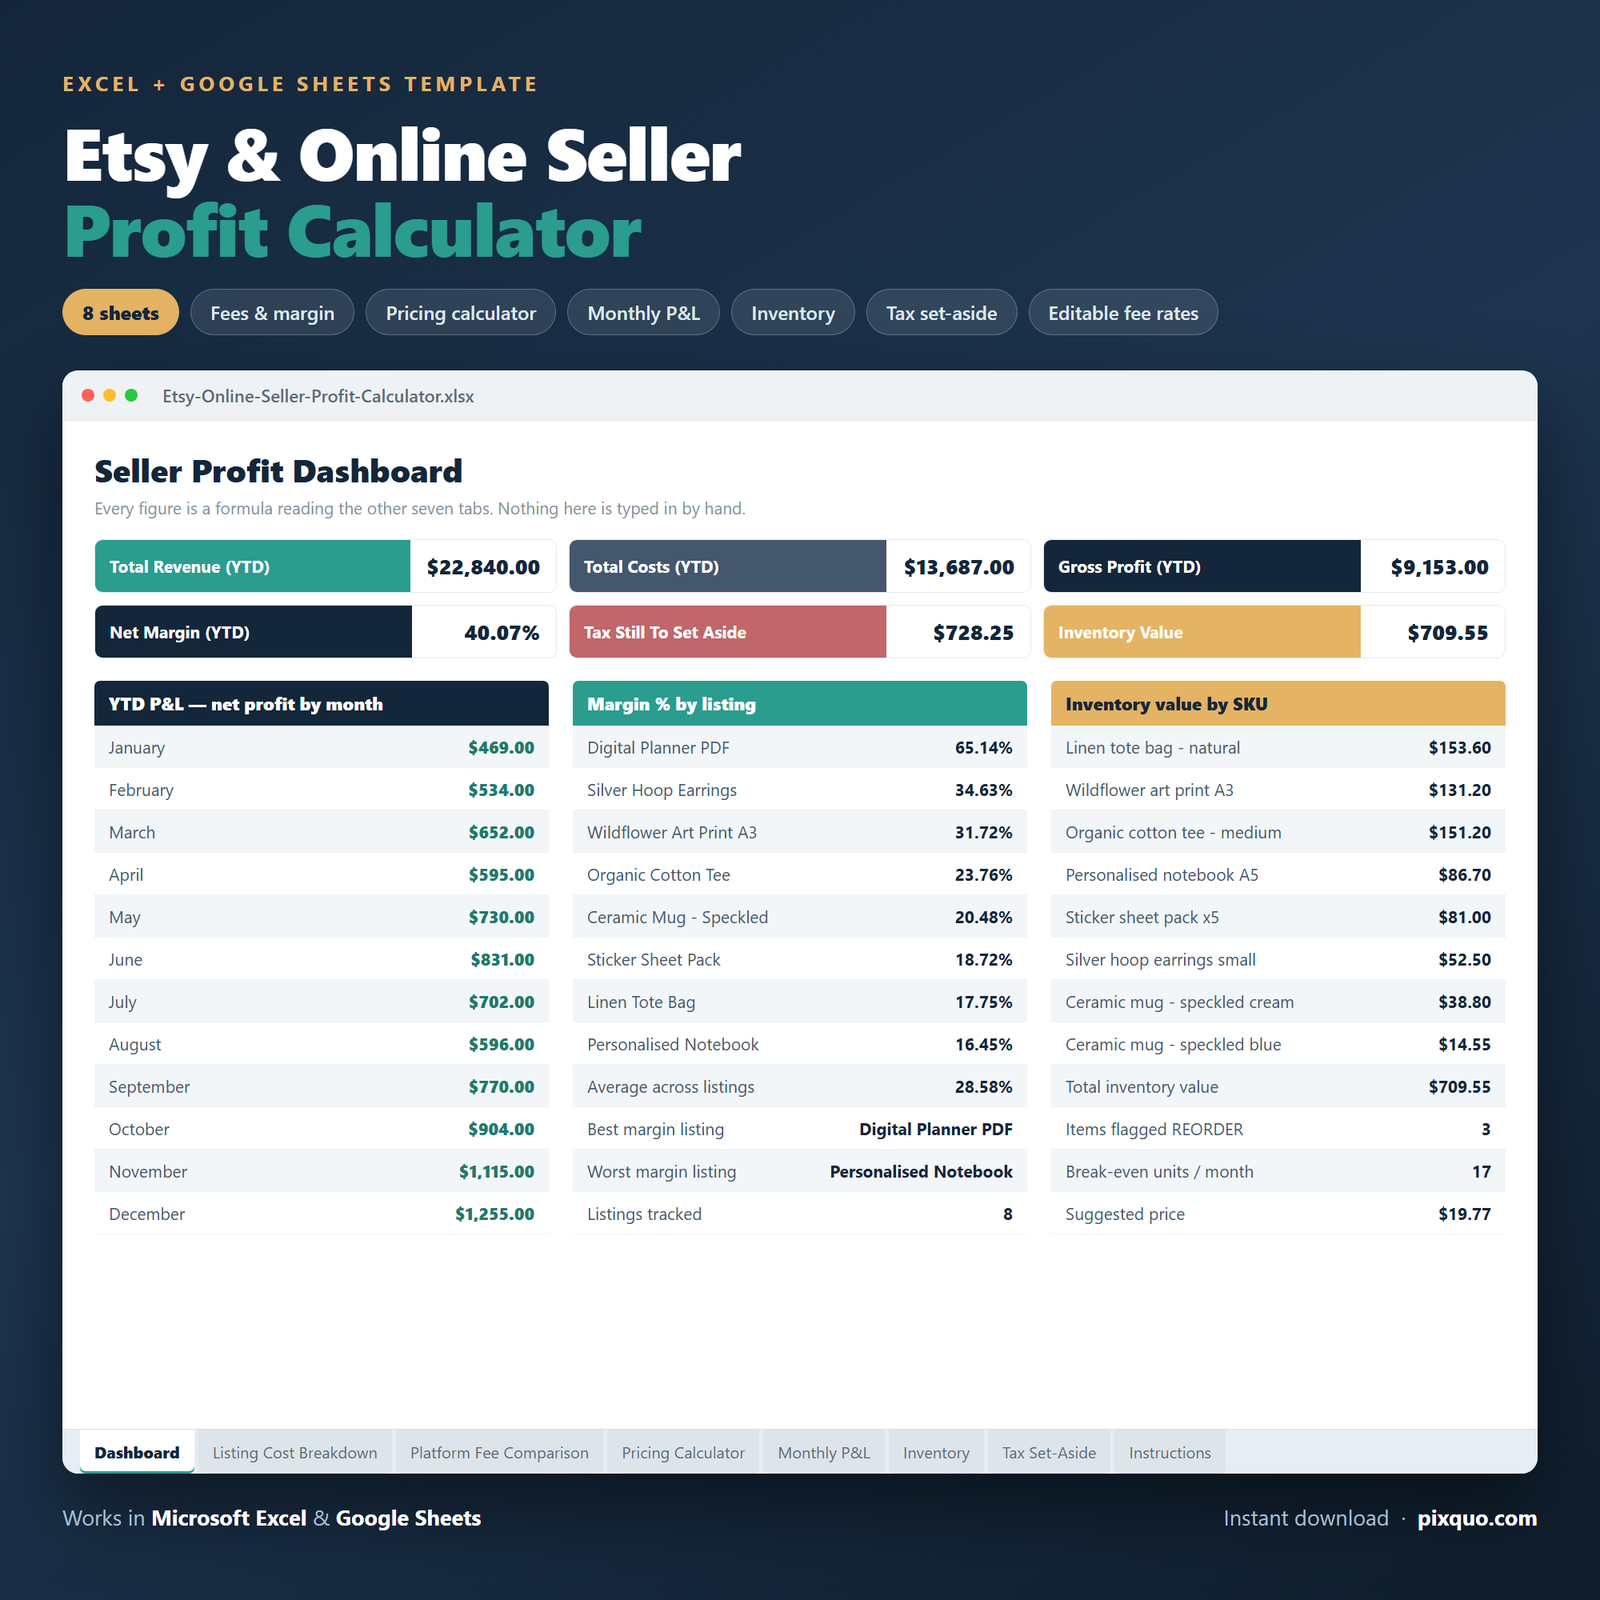
1. Dashboard. The read-only summary you check first: total revenue, total costs, gross profit and net margin % for the year, tax still to set aside, inventory value, break-even units and stock lines flagged for reorder. It also names your best-margin and worst-margin listing with the percentage for each, so the loss-leader hiding in your shop has nowhere left to hide. Three mini-tables break the year down by month, by platform and by category. Every cell here is a formula reading another sheet.
2. Listing Cost Breakdown. One row per listing: materials, labour hours, hourly rate, packaging, the shipping you pay, the shipping you charge, platform fees, payment processing and ad spend. Labour cost, total cost, profit and margin % calculate themselves. Category, platform and status are dropdowns so the dashboard groups your data properly. Forty rows are formula-ready, with eight worked examples pre-filled.
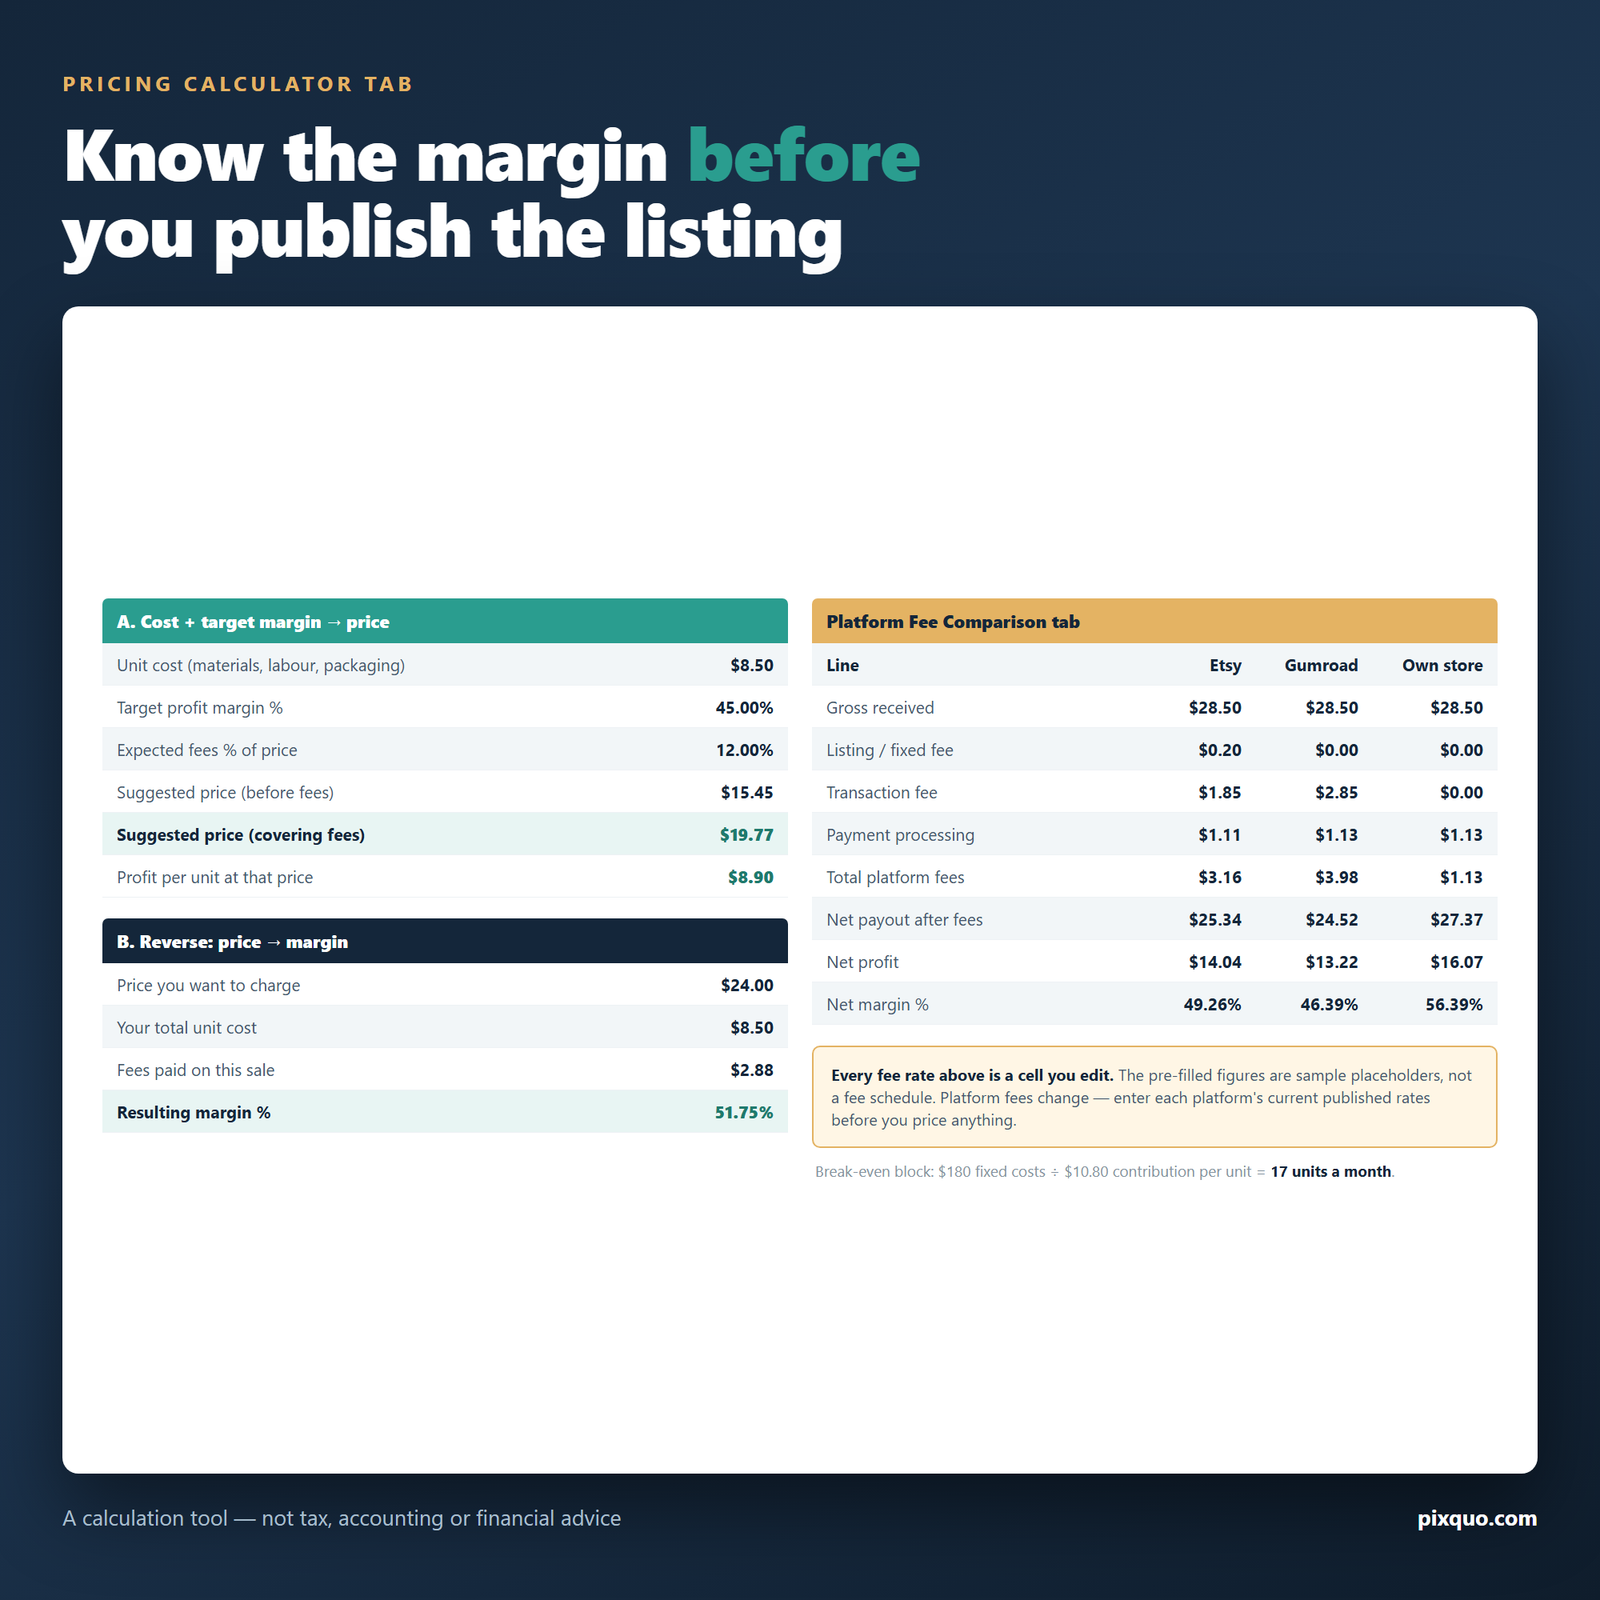
3. Platform Fee Comparison. Take one item and see what it nets you on Etsy, on Gumroad, and through your own store with Stripe checkout. Crucially, every fee rate is a yellow INPUT cell you edit — listing fee, transaction %, processing %, fixed fee and offsite ads %, for each of the three. Nothing is baked into the formulas. Per platform you get total fees, net payout, net profit, net margin % and the effective fee rate as a share of gross, plus which option nets you the most.
4. Pricing Calculator. Enter cost and target margin for a suggested price, plus a second price that also covers your expected fee percentage. Run it in reverse: enter a price, see the margin it actually leaves. A wholesale/retail multiplier block gives a trade price and an RRP with the margin on each. A break-even block turns fixed monthly costs and contribution per unit into units you must sell each month. A fifth block reads averages back off your own listing data.
5. Monthly P&L. Twelve months down the side; revenue, COGS, platform fees, ad spend, shipping and other expenses across the top. Total costs, net profit and margin % calculate per month, a running YTD net profit column accumulates through the year, and a year total row sums the lot. It also surfaces your best month and average monthly net profit.
6. Inventory. SKU, description, category, quantity on hand, unit cost, reorder point, inventory value (quantity × unit cost) and an automatic REORDER / OK flag. A total row gives the value of everything on your shelves and a count of lines needing restock.
7. Tax Set-Aside. Each month’s net profit pulls through from the P&L tab. Multiply by a set-aside percentage you choose in one yellow cell for the amount to reserve, the amount actually put aside, a running balance and the remaining shortfall.
8. Instructions. Every tab explained, how to clear the sample data without breaking the formulas, Google Sheets import, licence terms and the disclaimer.
Who this is for
- Handmade and craft sellers who need labour hours costed in, not quietly absorbed.
- Print-on-demand and dropship sellers whose base cost, shipping and ad spend leave a far thinner margin than the headline price suggests.
- Digital product sellers weighing marketplace reach against a lower-fee own-store checkout.
- Vintage and resale sellers tracking cost of goods per item against sale price.
- Multi-channel sellers who need marketplace, own-store and craft-fair numbers in one place.
- Anyone moving from hobby to business who now needs a real P&L, an inventory value and a tax reserve.
How to use it
In Microsoft Excel: download and double-click the file. If a yellow Protected View bar appears, click Enable Editing so the formulas calculate. Works in Excel for Windows, Excel for Mac and Microsoft 365.
In Google Sheets: in Google Drive choose New > File upload and upload the .xlsx, then right-click it and choose Open with > Google Sheets. Use File > Save as Google Sheets to keep a live copy. Formulas, dropdowns and frozen headers all carry across.
Then: start on Platform Fee Comparison and replace every yellow input with the rates each platform publishes today. Clear the sample rows with Clear contents, not Delete rows — deleting rows would break the TOTAL row and the dashboard links. Keep the header rows, TOTAL rows and the Dashboard and Instructions tabs intact, then enter your own data.
Formats and compatibility
One .xlsx workbook with eight sheets, delivered in a zip with a README. Works in Microsoft Excel and Google Sheets, and broadly compatible with LibreOffice Calc, Apple Numbers and WPS Office. Undated and unbranded, so it carries over year to year. Currency shows a dollar symbol by default and switches to any currency via the number format menu.
Licence and instant download
Your download link appears immediately after checkout and is emailed to you. Licensed for personal or single-business use: use it for yourself or your own business, on as many of your own devices as you like. You may not resell, redistribute, share, sublicense or repackage the file or its contents. As an instant digital download that cannot be returned once delivered, all sales are final.
Important — please read
This is a calculation and organising tool. It is not tax, accounting or financial advice. It reports only the figures you type into it, and it does not know your tax bands, thresholds, allowances, deductions or filing deadlines.
Platform fees change. Every fee rate here is an editable placeholder, deliberately so — fee schedules, processing rates and advertising charges shift over time and differ by country, currency, account type and category. Confirm each platform’s current published rates and enter them yourself before pricing anything. Nothing in this file forecasts or guarantees any sale, income, profit or business outcome; the sample rows exist purely so the dashboard shows live numbers on first open. Consult a qualified professional about your own situation.
Pairs well with
- Side Hustle Income & Expense Tracker — the wider picture across every income stream.
- Small Business Bookkeeping & Tax Spreadsheet — invoice tracking, mileage and a full P&L dashboard.
- Freelancer Income Tax Estimator — if client work sits alongside your product sales.
Free reading: digital product side hustles and budgeting and saving money.
Frequently asked questions
Does this work in Google Sheets, or is it Excel only?
Both. Upload the .xlsx to Google Drive and open it with Google Sheets — cross-sheet formulas, dropdowns, frozen headers, currency and percentage formats all carry over. Use File > Save as Google Sheets for a permanently live copy in Drive.
Are the platform fee rates already filled in for me?
There are numbers in those cells, but treat them as neutral placeholders, not a fee schedule — they exist so the sheet shows live results the moment you open it. Fees change and vary by country, currency, account type and category, so open each platform’s own published fee page and type today’s rates into the yellow INPUT cells. That is precisely why they are inputs rather than hard-coded formulas.
Can I add more than the pre-formatted rows?
Yes. Listing Cost Breakdown and Inventory are formula-ready for forty rows each. For more, insert rows above the TOTAL row and drag the formula cells down from the row above — the SUM ranges and the dashboard pick them up automatically.
Will it work for digital products with no shipping or stock?
Yes. Leave shipping cost, shipping charged, materials and packaging at zero and the maths still balances. The Inventory tab is simply optional — plenty of sellers use it only for their physical lines.
Is this a subscription, and do I need special software?
Neither. It is a one-off purchase of a single .xlsx file, delivered instantly. No account to create, no add-on to install, nothing to renew. Any spreadsheet app that reads .xlsx will open it, and Google Sheets is free.
Trademark note: Etsy, Gumroad, Stripe, Microsoft Excel and Google Sheets are trademarks of their respective owners. All third-party platform names are used nominatively only — for compatibility and to label which fee rates you are entering. This is an independent product, not affiliated with, endorsed by or sponsored by any of them.
Explore More Digital Tools
- Browse the full shop — planners, trackers, prompt packs and printables
- Free printables library
- Budgeting & saving guide · Planners & productivity guide
- Paper sizes & currency by country
Every Pixquo product is an instant download — no shipping, no waiting.
Reviews
There are no reviews yet.