
Description
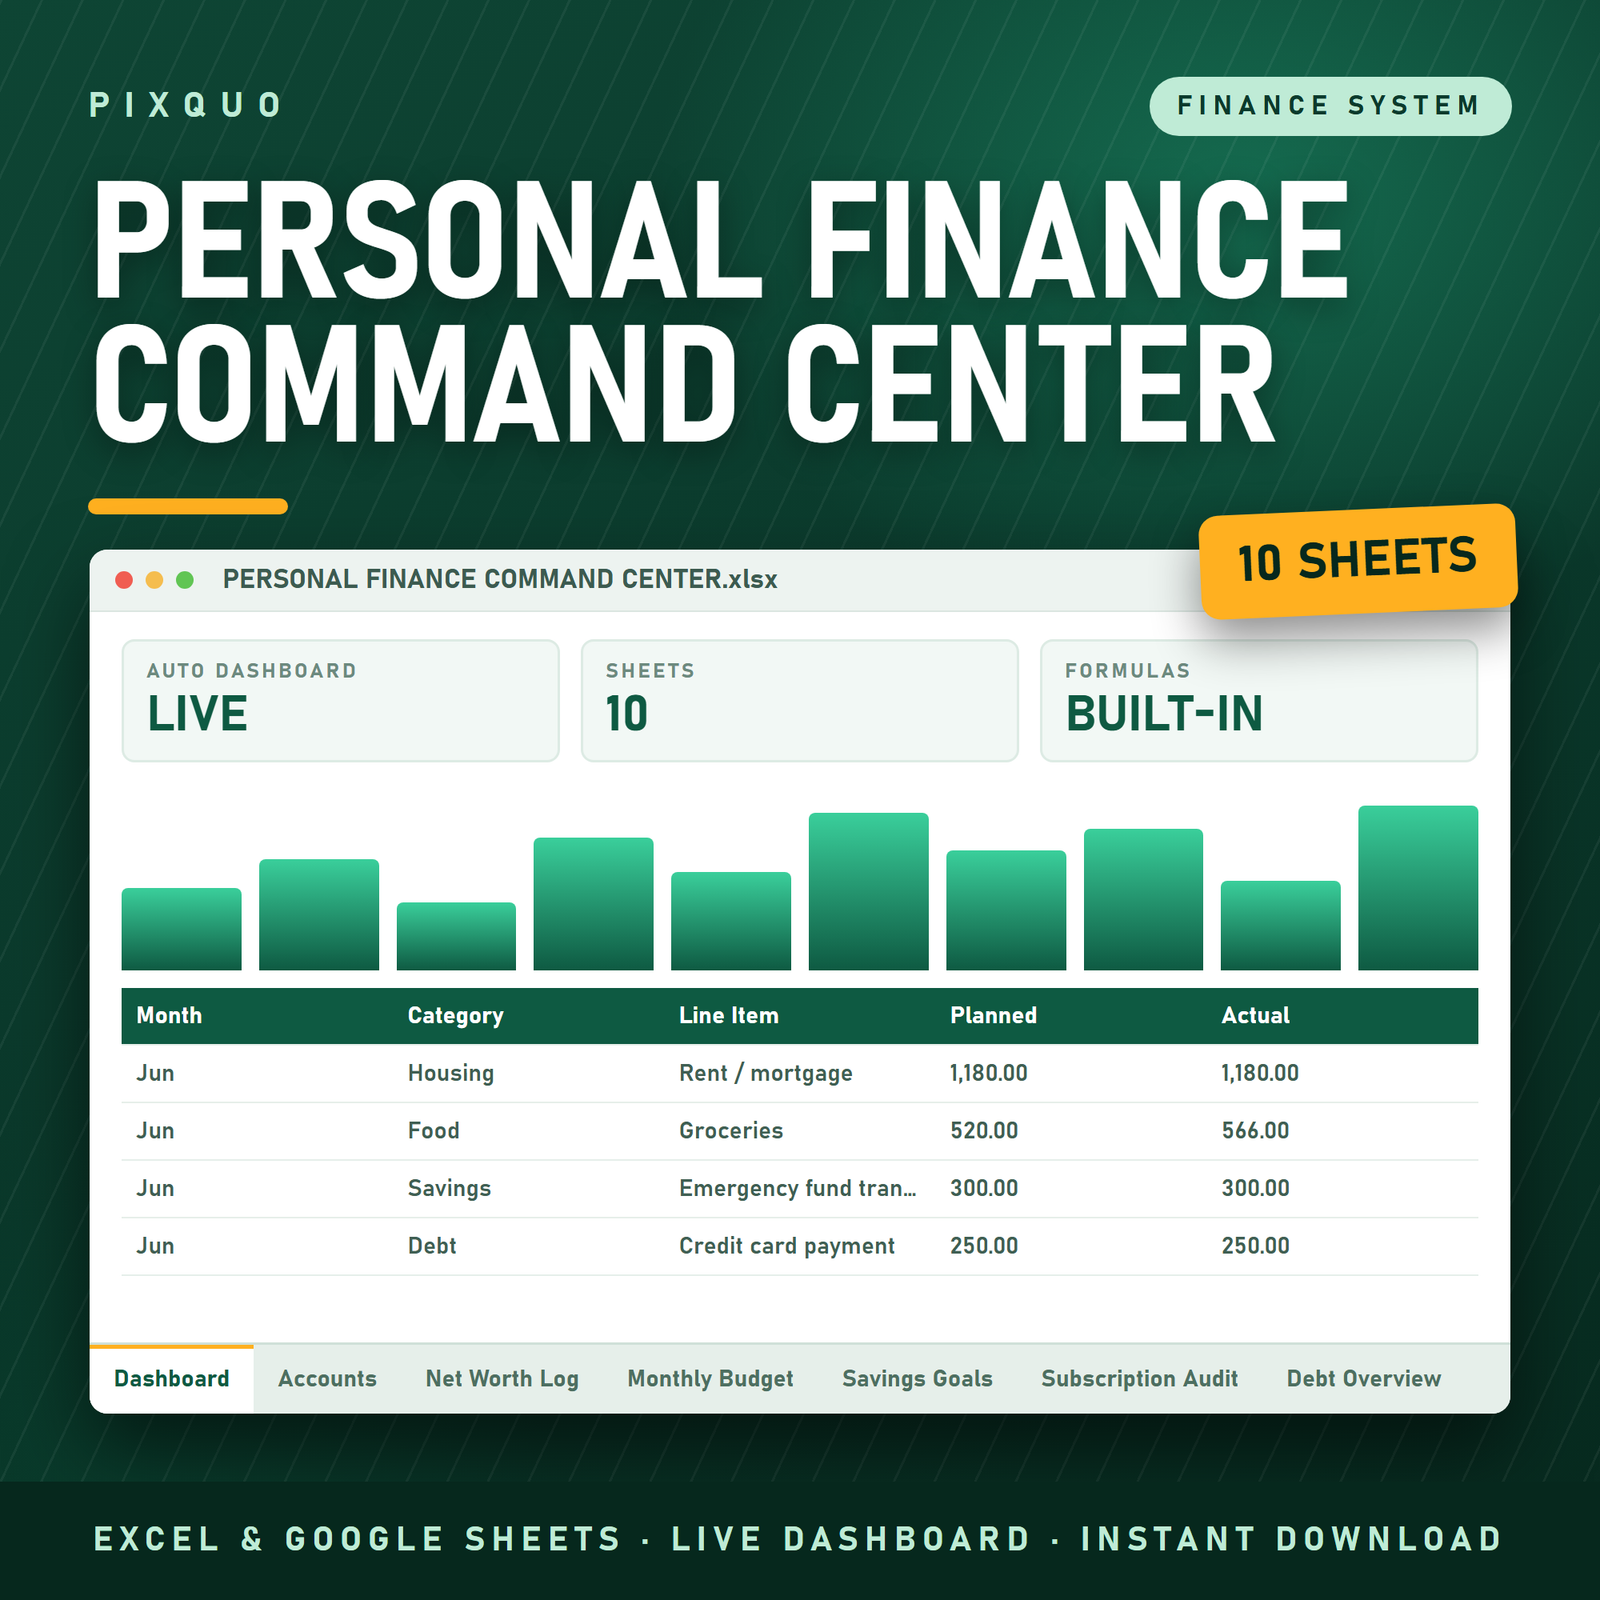
Your whole financial picture on one screen — instead of four apps, three bank tabs and a shoebox of assumptions. The Personal Finance Command Center is a 10-sheet Excel and Google Sheets workbook that connects everything you own, everything you owe, what you spend, what you save and what you invest into a single live dashboard. Enter a number once and every total that depends on it updates itself.
Most budget templates only answer one question: “did I overspend on groceries?” That is useful for a month and useless for a decade. The questions that actually change your finances are bigger — is my net worth going up? how much of my income is committed before I get to choose anything? which debt do I attack first? what are those subscriptions really costing me over a year? This workbook is built around those questions, and it keeps answering them month after month with about ten minutes of upkeep.
What you get — all 10 sheets
1. Dashboard. Read-only, entirely formula-driven, grouped into six bands: net worth, this month, debt, saving and investing, subscriptions, and year to date. Roughly forty live figures including net worth, total assets, total liabilities, liabilities as a percentage of assets, money left over this month, savings rate, your biggest overspend against plan, total debt, debt excluding mortgage, debt payments as a share of income, both payoff targets, goal completion percentage, investment gain and return, months of expenses your emergency fund covers, subscription cost per month and per year, and your year-to-date savings rate.
2. Accounts. Your master list: sixty rows for current accounts, savings, cash, cards, loans, investments, retirement, property and vehicles. One dropdown marks each line Asset or Liability, and that single column drives net worth everywhere else in the file.
3. Net Worth Log. Thirty-six monthly snapshot rows. Net worth and month-on-month change calculate automatically, gains show green and drops show red, and data bars turn the column into a trend line you can read at a glance. Growth since your first entry is calculated at the bottom.
4. Monthly Budget. Sixty line items with a Planned column, an Actual column, an automatic Difference that turns red the moment you go over, and a percentage-of-income column. Underneath sits a full group breakdown — housing, utilities, food, transport, insurance, health, debt payments, savings, family, personal, fun and other — with planned versus actual for each group and data bars showing where the money really goes. Income, total spending, money left over and your savings rate all calculate at the foot of the sheet.
5. Savings Goals. Thirty goals with a target amount and a target date. The sheet works out what is still remaining, how many months are left, and — the part people actually want — exactly how much you need to set aside each month to arrive on time. Completion percentage shows as a progress bar.
6. Subscription Audit. Forty rows for every recurring charge. Enter the amount and the billing cycle (weekly, monthly, quarterly, six-monthly or annual) and the sheet normalises everything to a true monthly and annual figure so an $99-a-year service and a $9-a-month service can finally be compared. Tag each one Keep, Review or Cancel and the totals show precisely what cancelling would save you over a year.
7. Debt Overview. Balances, interest rates, minimum payments and any extra payment, with an estimated number of months to payoff calculated for each debt. The sheet names your snowball target (smallest balance) and your avalanche target (highest rate) so you can pick a method and stop second-guessing it, and it separates total debt from debt excluding your mortgage.
8. Investment Tracker. Thirty holdings with cost basis and current value, producing gain or loss, return percentage and each holding’s share of your portfolio, plus an allocation summary by asset class with bars. Record-keeping, not stock picking.
9. Annual Summary. Twelve rows, one per month: income, spending, saved or invested, debt paid, automatic surplus, cumulative savings and monthly savings rate — with year totals, monthly averages and your best saving month identified for you.
10. Instructions. A proper setup guide: the order to fill things in, the ten-minute monthly routine, what every tab does, how to change the currency, how to clear the sample data safely, and the licence.
Who this is for
People who have outgrown a one-page budget. If you have more than two accounts, any debt beyond a single card, a couple of savings goals, and a growing suspicion that your subscriptions have quietly got out of hand, this is built for you. It suits couples running joint and separate accounts, anyone tracking net worth for the first time, people paying down debt while still trying to save, and anyone who wants an annual view rather than a monthly panic. It works just as well for a first proper budget as it does for someone with a mortgage, a pension and a brokerage account.
How to use it
Set-up takes about half an hour, once. Start on the Accounts tab and list everything you own and owe, marking each line Asset or Liability. Move to Debt Overview and enter balances, rates and minimum payments. Then do the Subscription Audit — this is the tab that usually pays for the template on day one. Fill in the Monthly Budget, set a target amount and date on each savings goal, add your holdings to the Investment Tracker, and open the Dashboard. Every figure is now live.
After that it is ten minutes a month: finish the Actual column, copy your account totals into the next row of the Net Worth Log on roughly the same day each month, add the month to the Annual Summary, and read three numbers on the Dashboard — money left over, savings rate, and debt excluding mortgage. Those three tell you almost everything. If you want a paper trail, duplicate the Monthly Budget tab for each new month.
Every log tab ships with a handful of sample rows so the dashboard shows live numbers the moment you open it. The Instructions tab explains how to clear them without breaking the totals.
Formats and compatibility
One .xlsx file, delivered in a ZIP. Opens directly in Microsoft Excel on Windows and Mac, and in Google Sheets via Drive → New → File upload → Open with Google Sheets (formulas, dropdowns, frozen headers, conditional formatting and data bars all carry across). It also opens in LibreOffice Calc and Numbers, though very complex conditional formatting can render differently there. No macros, no add-ons, no subscription, nothing to install. Currency symbols are a formatting choice, so the file works in any currency — change the number format and the maths is unaffected.
Pairs well with
- Annual Budget & Paycheck Planner Spreadsheet — if you are paid weekly or fortnightly and want the budget mapped to paydays rather than calendar months.
- Debt Payoff & Snowball Tracker Spreadsheet — a dedicated payoff planner with month-by-month schedules and interest-saved figures if debt is your main focus.
- Subscription & Bill Tracker — a lighter standalone tracker for recurring bills and renewal dates.
Free reading first
New to this? Start with our guide to zero-based budgeting for a method that pairs naturally with the Monthly Budget tab, then read debt snowball vs avalanche before you choose which target to chase on the Debt Overview tab. You can also browse the full budget spreadsheet templates collection.
Does this work in Google Sheets, or only Excel?
Both. Upload the .xlsx to Google Drive, right-click it and choose Open with → Google Sheets, then File → Save as Google Sheets to keep a live copy. Formulas, dropdown menus, frozen headers, conditional formatting and the data bars all carry over. Nothing in the file relies on Excel-only features or macros.
Can I use it in a currency other than dollars?
Yes. The sample formatting uses a dollar sign, but every calculation is currency-agnostic. Select the columns you want to change and apply your own currency format in Excel or Google Sheets. Dates are stored as real dates, so you can switch to any regional date format the same way.
Is this dated? Will it expire at the end of the year?
No. It is undated. The Annual Summary uses month names rather than a fixed year, the Net Worth Log takes whatever label you type, and the Monthly Budget has a free-text month cell. Use the same file for years, or duplicate it each January if you prefer a clean annual copy.
What if I do not have investments or a mortgage yet?
Leave those tabs empty. Every dashboard formula is written so that blank rows simply return zero rather than an error, so the file works perfectly with two accounts and one savings goal, and it will still be there when your situation gets more complicated.
Is my financial data sent anywhere?
No. This is an offline spreadsheet file. There is no account to create, no bank connection, no sync and no telemetry. Your numbers stay in your own copy of the file, wherever you keep it.
Instant download & licence
This is a digital download — your file is available immediately after checkout, with unlimited re-downloads and no expiry. Nothing is posted to you. Licensed for personal use by you and your own household, on as many of your own devices as you like. You may not resell, redistribute, share or repackage the file or its contents.
Not financial advice. This workbook is an organising and calculation tool only. It is not financial, investment, tax, accounting or legal advice, and it does not guarantee any outcome. Every figure it produces depends entirely on the numbers you enter. Check your own figures and speak to a qualified professional about your situation.
Microsoft Excel is a trademark of Microsoft Corporation and Google Sheets is a trademark of Google LLC. This product is independent and is not affiliated with, endorsed by or sponsored by Microsoft or Google; those names are used descriptively only, to tell you where the file opens.
Explore More Digital Tools
- Browse the full shop — planners, trackers, prompt packs and printables
- Free printables library
- Budgeting & saving guide · Planners & productivity guide
- Paper sizes & currency by country
Every Pixquo product is an instant download — no shipping, no waiting.


Reviews
There are no reviews yet.