Rental Property & Landlord Spreadsheet | Excel & Google Sheets | Rent Roll, Tenant Tracker, Expense & Maintenance Log, Cap Rate Dashboard

Original price was: $39.99.Current price is: $16.99.
  • Instant download — access right after checkout
  • 📱 Works on any device — phone, tablet or computer
  • 🖨 Print at home — A4 & US Letter where applicable
  • 🔒 Secure checkout & unlimited re-downloads

Track rent, arrears, expenses, tenants, maintenance and equity across every rental you own. Nine linked sheets for Excel and Google Sheets.

Description

Most landlords do not lose money because they picked a bad property. They lose it in the gaps: the month a tenant paid short and nobody chased it, the boiler receipt that never reached the accountant, the lease that quietly expired while a room sat empty for six weeks. One property is manageable in your head. Three is not.

The numbers are not hard to calculate. They are just scattered across the bank app, the agent’s statement, the thread with the plumber, and a mortgage statement in a drawer. So the question every landlord eventually asks, is this property actually making me money after everything, goes unanswered until an accountant answers it in March from whatever paperwork you found.

This is one workbook that closes those gaps. Nine sheets wired together with formulas, so a transaction entered once lands in the dashboard, the per-property breakdown and the tax summary at the same time. It ships with three example properties and four example tenants filled in, so you can watch the formulas work before typing anything, then clear the samples and enter your own portfolio.

What’s inside

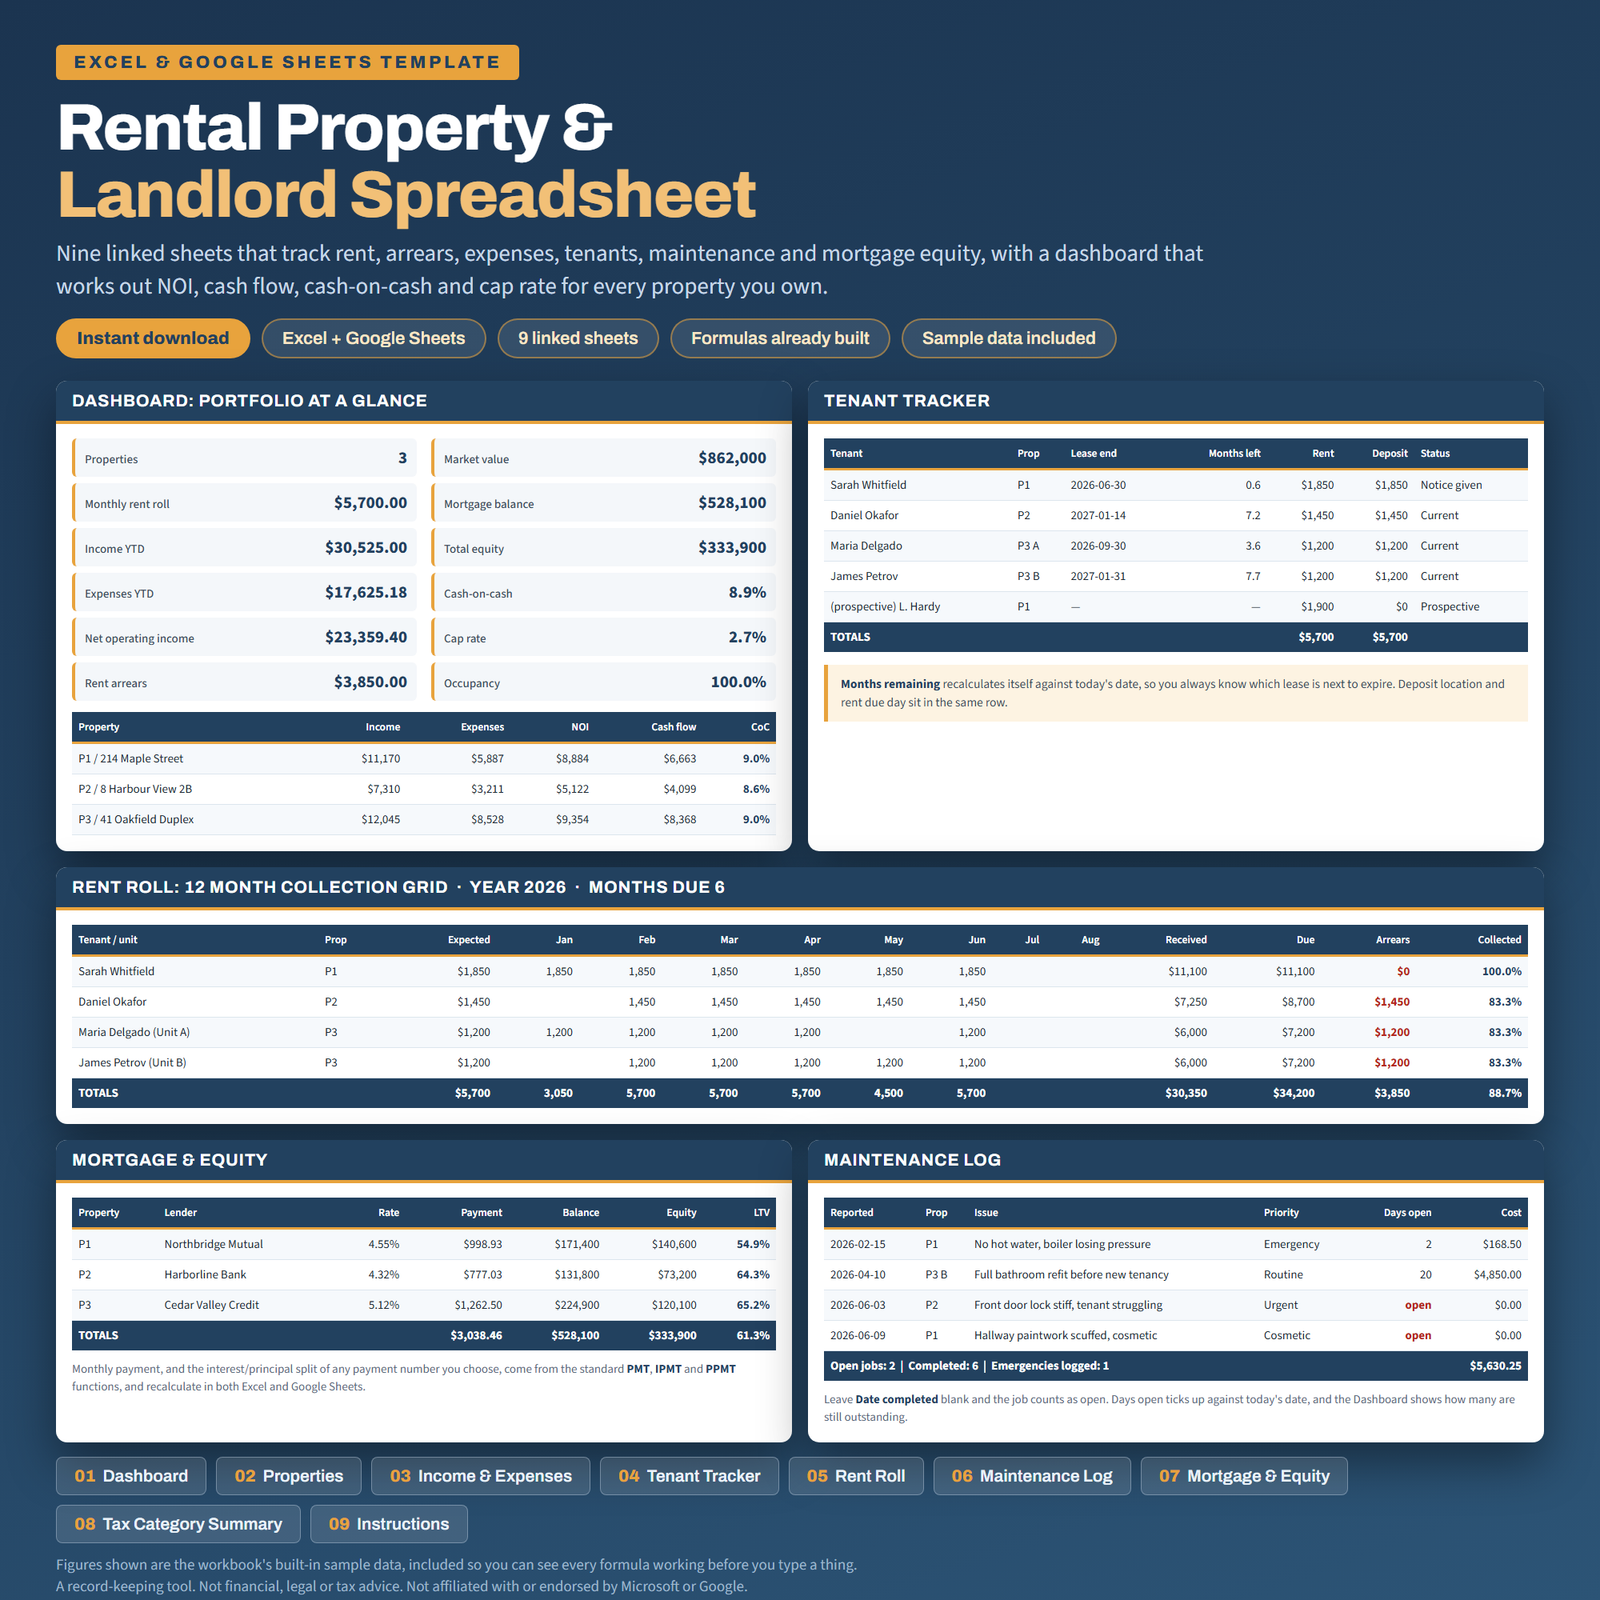
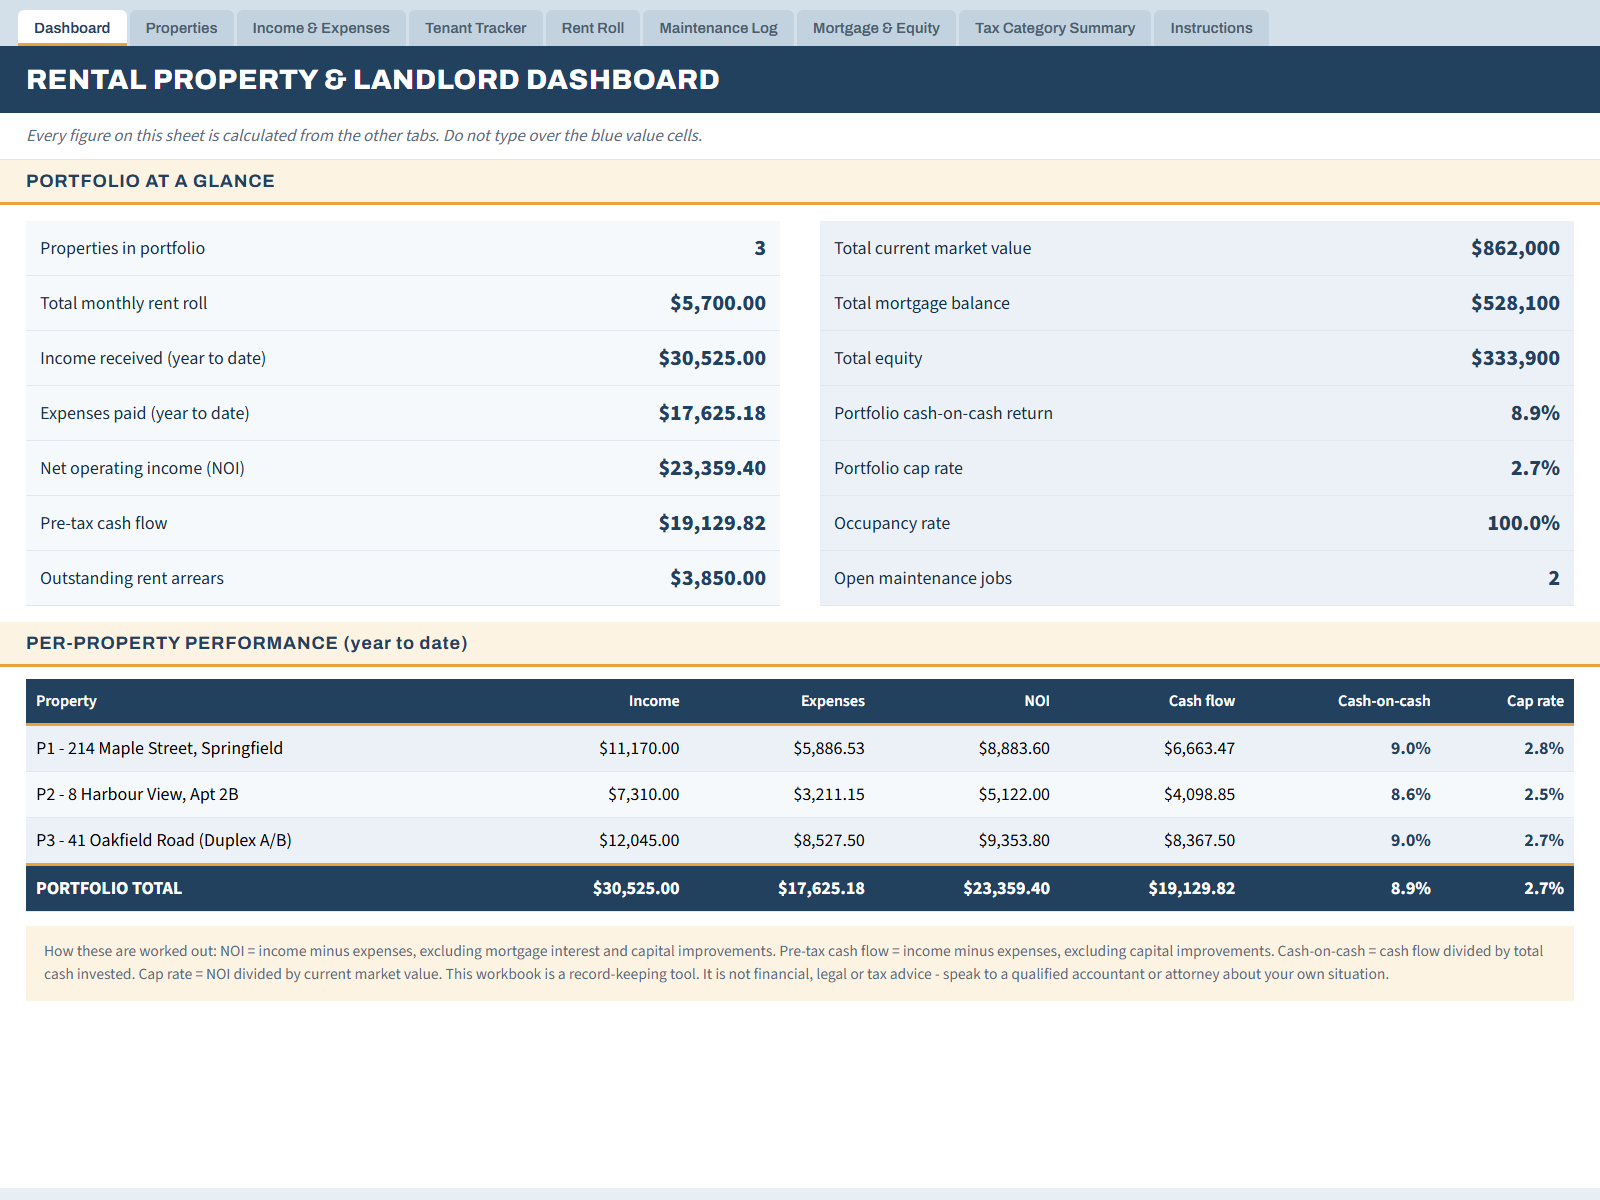
1. Dashboard. Fourteen portfolio figures, all calculated, none typed: properties owned, monthly rent roll, income and expenses year to date, net operating income, pre-tax cash flow, market value, mortgage balance, equity, cash-on-cash return, cap rate, occupancy, outstanding arrears and open maintenance jobs. Below that, a per-property table putting each property’s income, expenses, NOI, cash flow, cash-on-cash and cap rate side by side, so you can see which one carries the portfolio. Every formula is wrapped in IFERROR, so an empty workbook shows zeros rather than error codes.

2. Properties. The master list, and the spine of the file. Property ID, address, type (dropdown: single family, condo, duplex, multi-unit, room, commercial), purchase date, price, closing costs, rehab spend, total cash invested, market value, monthly rent and status. Total cash invested is a formula: price plus closing costs plus rehab, minus the loan on the mortgage sheet. That is the money that actually left your pocket, which is what makes cash-on-cash meaningful.

3. Income & Expenses. The ledger everything reads from. Date, property (dropdown fed by your Properties list), type, category, description, amount, payment method, tax deductible, receipt filed, notes. Nineteen categories come pre-loaded, from rent and late fees through mortgage interest, property tax, insurance, HOA, repairs, management fees and capital improvements. That consistency is what lets the tax summary sort itself. Filters on every column.

4. Tenant Tracker. Tenant, property, unit, phone, email, lease start and end, months remaining, monthly rent, deposit held, deposit location, rent due day, status and notes. Months remaining is a live formula against today’s date, so an expiring lease moves to the top of your attention by itself instead of surprising you.

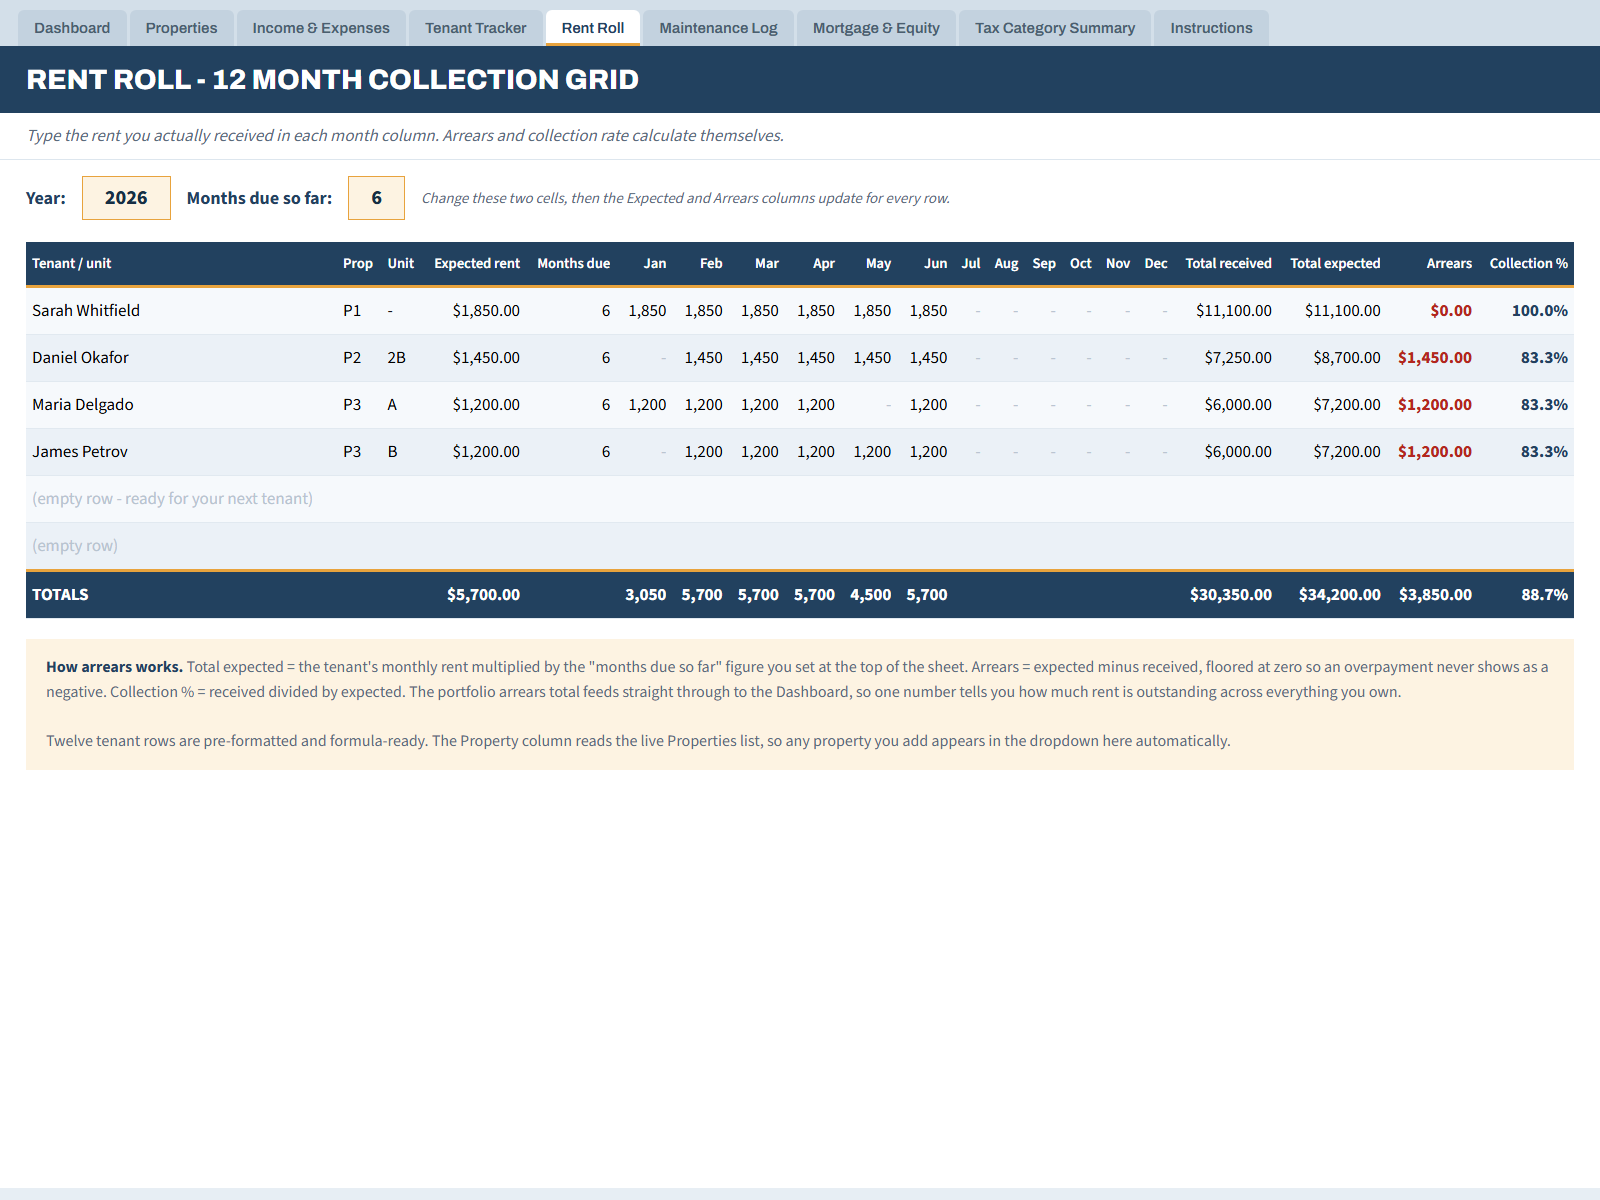
5. Rent Roll. A twelve-month collection grid, one row per tenant or unit. Set the year and how many months are due in two cells at the top, then type what you actually received each month. Each row calculates total received, total expected, arrears and collection percentage, and portfolio arrears feeds back to the dashboard. Arrears is floored at zero, so an overpaying tenant cannot quietly flatter your numbers.

6. Maintenance Log. Date reported, property, unit, issue, priority (emergency, urgent, routine, cosmetic), contractor, date completed, days open, cost, capital or repair, warranty notes. Leave the completion date blank and the job counts as open: days open ticks up against today’s date and the dashboard counts what is outstanding. The capital-or-repair column is the difference between an expense and an improvement once your accountant sees it.

7. Mortgage & Equity. One row per loan: lender, original loan, rate, term, start date, monthly payment, current balance, current value, equity, LTV, plus an amortisation estimate splitting any payment you choose into interest and principal. These use the standard PMT, IPMT and PPMT functions, which recalculate in both Excel and Sheets. Equity and LTV update from the market value on your Properties sheet.

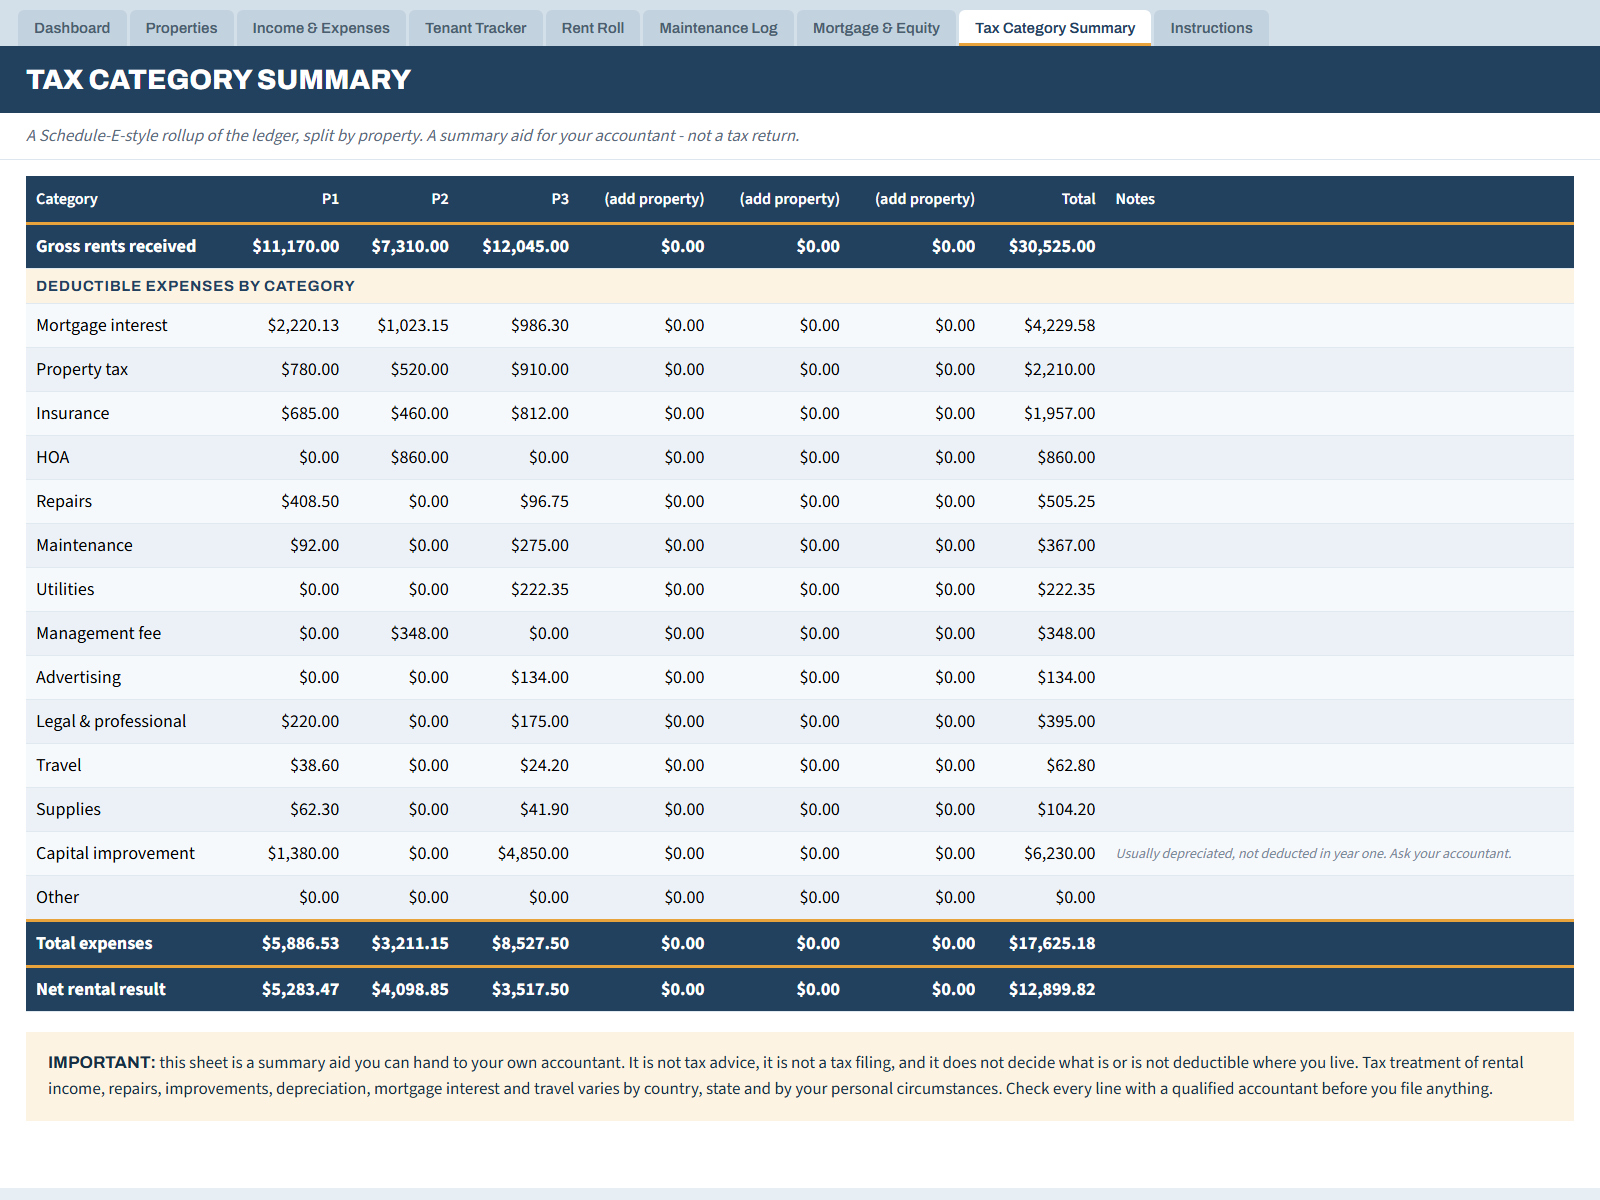
8. Tax Category Summary. A Schedule-E-style rollup: each deductible category as a row, each property as a column, plus a total column, a gross rents row and a net result row. Built so you can hand one page to your accountant instead of a folder, and carrying a clear note that it is a summary aid, not a filing.

9. Instructions. How the sheets link, which sample rows to clear and which formula columns to leave alone, how to add a property so it appears in every dropdown at once, plain-English definitions of how cash-on-cash and cap rate are calculated here, Excel versus Sheets notes, and licence terms.

Who it’s for

Someone who has just bought a second or third rental and finds the mental arithmetic no longer works. An accidental landlord renting out a former home who needs clean records for an accountant. A duplex owner who wants the real cash-on-cash per door rather than a vague sense that it is fine. Someone self-managing after leaving a letting agent, who has inherited the admin the agent used to absorb.

Who it is not for: if you own thirty units you want property management software with tenant portals and payment reconciliation, not a spreadsheet. There are no automatic bank feeds – you enter transactions yourself. And it will not file your taxes or rule on what is deductible where you live.

How to use it

Open the Dashboard with the sample data still in place, so you can see what each figure does. Then follow the clearing list on the Instructions sheet, which names the exact rows and columns to delete. Enter your properties, your loans and your current tenants, set the year and months-due cells on the Rent Roll, and log transactions as they happen. About fifteen minutes to set up, a couple of minutes a week after that.

Formats and compatibility

A ZIP containing one .xlsx workbook with all nine sheets, plus a plain-text read-me covering setup and licence. It opens directly in Excel 2016 or later, Microsoft 365 and Excel for Mac, and imports into Google Sheets via File, Import, Upload with formulas and dropdowns intact. Numbers and LibreOffice Calc open it too, though formatting is less predictable there. Currency is in dollars and changes in one step. No macros, no add-ons, no subscription.

If you are still deciding whether to buy the next property rather than tracking the ones you have, the Real Estate Investment Property Analyzer models the purchase, while this workbook runs it once you own it. Landlords who also trade through a company tend to pair this with the Small Business Bookkeeping & Tax Spreadsheet, keeping the rental ledger and the trading accounts separate at year end. And since property equity is usually a landlord’s largest balance-sheet line, the total equity figure here drops straight into the Personal Net Worth & Financial Goals Tracker.

For wider context, our guide to budgeting and saving money covers the habit side of keeping records that actually get maintained, and the digital product side hustles guide covers other routes people take alongside property.

Does this work in Google Sheets, or do I need Excel?

You do not need Excel. Upload the .xlsx to Google Drive, use File then Import, and Sheets converts it, formulas and dropdowns included. Two small differences: the dropdown arrow sometimes appears only once you click a cell, and mortgage figures may round to different decimals. Nothing breaks.

Can I edit it, or is it locked down?

Completely unlocked. No password, no protected sheets, no hidden tabs. Add columns, rename categories, change the colours, extend the formula rows down. The Instructions sheet flags which columns hold formulas, so you know what recalculates if you move things around.

Will it go out of date, or only work for one year?

There are no hardcoded years in the calculations. The Rent Roll has a year cell you set yourself, and the date-driven formulas, months left on a lease and days a job has been open, work off today’s date. At year end, save a copy and start a fresh rent roll, or keep going in the same file.

How many properties can it hold?

The sheets are formula-ready for up to 100 properties, 300 ledger transactions, 12 rent-roll rows and 120 maintenance jobs, each extendable by copying the last formula row down. The dashboard table shows the first ten properties and the tax summary splits across six columns.

I am not a spreadsheet person. Will I follow it?

The sample data exists for exactly that. Nothing is blank when you open it: you see a filled dashboard, a working rent roll and a real ledger, so you copy a pattern rather than invent one. Dropdowns mean you pick categories instead of mistyping them, and the Instructions sheet names the precise cells to delete.

Instant download. The ZIP is available immediately after checkout, with no expiry and no download limit. Personal-use licence: use it for your own portfolio and keep as many working copies as you like; reselling, redistributing, sharing the file publicly or re-templating it are not permitted.

This workbook is a record-keeping and organisational tool. It is not financial, legal or tax advice. Tax rules vary by country, state and situation – consult a qualified accountant or attorney about yours. All figures in the workbook and preview images are invented sample data, included so the formulas can be seen working. Nothing here is a projection or a guarantee of any return.

Microsoft and Excel are trademarks of Microsoft Corporation. Google and Google Sheets are trademarks of Google LLC. This product is an independent template and is not affiliated with, authorised by, or endorsed by Microsoft or Google.

Explore More Digital Tools

Every Pixquo product is an instant download — no shipping, no waiting.
Reviews

There are no reviews yet.

Be the first to review “Rental Property & Landlord Spreadsheet | Excel & Google Sheets | Rent Roll, Tenant Tracker, Expense & Maintenance Log, Cap Rate Dashboard”

Your email address will not be published. Required fields are marked *

Product Details

Most landlords do not lose money because they picked a bad property. They lose it in the gaps: the month a tenant paid short and nobody chased it, the boiler receipt that never reached the accountant, the lease that quietly expired while a room sat empty for six weeks. One property is manageable in your head. Three is not.

The numbers are not hard to calculate. They are just scattered across the bank app, the agent's statement, the thread with the plumber, and a mortgage statement in a drawer. So the question every landlord eventually asks, is this property actually making me money after everything, goes unanswered until an accountant answers it in March from whatever paperwork you found.

This is one workbook that closes those gaps. Nine sheets wired together with formulas, so a transaction entered once lands in the dashboard, the per-property breakdown and the tax summary at the same time. It ships with three example properties and four example tenants filled in, so you can watch the formulas work before typing anything, then clear the samples and enter your own portfolio.

What's inside

1. Dashboard. Fourteen portfolio figures, all calculated, none typed: properties owned, monthly rent roll, income and expenses year to date, net operating income, pre-tax cash flow, market value, mortgage balance, equity, cash-on-cash return, cap rate, occupancy, outstanding arrears and open maintenance jobs. Below that, a per-property table putting each property's income, expenses, NOI, cash flow, cash-on-cash and cap rate side by side, so you can see which one carries the portfolio. Every formula is wrapped in IFERROR, so an empty workbook shows zeros rather than error codes.

2. Properties. The master list, and the spine of the file. Property ID, address, type (dropdown: single family, condo, duplex, multi-unit, room, commercial), purchase date, price, closing costs, rehab spend, total cash invested, market value, monthly rent and status. Total cash invested is a formula: price plus closing costs plus rehab, minus the loan on the mortgage sheet. That is the money that actually left your pocket, which is what makes cash-on-cash meaningful.

3. Income & Expenses. The ledger everything reads from. Date, property (dropdown fed by your Properties list), type, category, description, amount, payment method, tax deductible, receipt filed, notes. Nineteen categories come pre-loaded, from rent and late fees through mortgage interest, property tax, insurance, HOA, repairs, management fees and capital improvements. That consistency is what lets the tax summary sort itself. Filters on every column.

4. Tenant Tracker. Tenant, property, unit, phone, email, lease start and end, months remaining, monthly rent, deposit held, deposit location, rent due day, status and notes. Months remaining is a live formula against today's date, so an expiring lease moves to the top of your attention by itself instead of surprising you.

5. Rent Roll. A twelve-month collection grid, one row per tenant or unit. Set the year and how many months are due in two cells at the top, then type what you actually received each month. Each row calculates total received, total expected, arrears and collection percentage, and portfolio arrears feeds back to the dashboard. Arrears is floored at zero, so an overpaying tenant cannot quietly flatter your numbers.

6. Maintenance Log. Date reported, property, unit, issue, priority (emergency, urgent, routine, cosmetic), contractor, date completed, days open, cost, capital or repair, warranty notes. Leave the completion date blank and the job counts as open: days open ticks up against today's date and the dashboard counts what is outstanding. The capital-or-repair column is the difference between an expense and an improvement once your accountant sees it.

7. Mortgage & Equity. One row per loan: lender, original loan, rate, term, start date, monthly payment, current balance, current value, equity, LTV, plus an amortisation estimate splitting any payment you choose into interest and principal. These use the standard PMT, IPMT and PPMT functions, which recalculate in both Excel and Sheets. Equity and LTV update from the market value on your Properties sheet.

8. Tax Category Summary. A Schedule-E-style rollup: each deductible category as a row, each property as a column, plus a total column, a gross rents row and a net result row. Built so you can hand one page to your accountant instead of a folder, and carrying a clear note that it is a summary aid, not a filing.

9. Instructions. How the sheets link, which sample rows to clear and which formula columns to leave alone, how to add a property so it appears in every dropdown at once, plain-English definitions of how cash-on-cash and cap rate are calculated here, Excel versus Sheets notes, and licence terms.

Who it's for

Someone who has just bought a second or third rental and finds the mental arithmetic no longer works. An accidental landlord renting out a former home who needs clean records for an accountant. A duplex owner who wants the real cash-on-cash per door rather than a vague sense that it is fine. Someone self-managing after leaving a letting agent, who has inherited the admin the agent used to absorb.

Who it is not for: if you own thirty units you want property management software with tenant portals and payment reconciliation, not a spreadsheet. There are no automatic bank feeds - you enter transactions yourself. And it will not file your taxes or rule on what is deductible where you live.

How to use it

Open the Dashboard with the sample data still in place, so you can see what each figure does. Then follow the clearing list on the Instructions sheet, which names the exact rows and columns to delete. Enter your properties, your loans and your current tenants, set the year and months-due cells on the Rent Roll, and log transactions as they happen. About fifteen minutes to set up, a couple of minutes a week after that.

Formats and compatibility

A ZIP containing one .xlsx workbook with all nine sheets, plus a plain-text read-me covering setup and licence. It opens directly in Excel 2016 or later, Microsoft 365 and Excel for Mac, and imports into Google Sheets via File, Import, Upload with formulas and dropdowns intact. Numbers and LibreOffice Calc open it too, though formatting is less predictable there. Currency is in dollars and changes in one step. No macros, no add-ons, no subscription.

If you are still deciding whether to buy the next property rather than tracking the ones you have, the Real Estate Investment Property Analyzer models the purchase, while this workbook runs it once you own it. Landlords who also trade through a company tend to pair this with the Small Business Bookkeeping & Tax Spreadsheet, keeping the rental ledger and the trading accounts separate at year end. And since property equity is usually a landlord's largest balance-sheet line, the total equity figure here drops straight into the Personal Net Worth & Financial Goals Tracker.

For wider context, our guide to budgeting and saving money covers the habit side of keeping records that actually get maintained, and the digital product side hustles guide covers other routes people take alongside property.

Does this work in Google Sheets, or do I need Excel?

You do not need Excel. Upload the .xlsx to Google Drive, use File then Import, and Sheets converts it, formulas and dropdowns included. Two small differences: the dropdown arrow sometimes appears only once you click a cell, and mortgage figures may round to different decimals. Nothing breaks.

Can I edit it, or is it locked down?

Completely unlocked. No password, no protected sheets, no hidden tabs. Add columns, rename categories, change the colours, extend the formula rows down. The Instructions sheet flags which columns hold formulas, so you know what recalculates if you move things around.

Will it go out of date, or only work for one year?

There are no hardcoded years in the calculations. The Rent Roll has a year cell you set yourself, and the date-driven formulas, months left on a lease and days a job has been open, work off today's date. At year end, save a copy and start a fresh rent roll, or keep going in the same file.

How many properties can it hold?

The sheets are formula-ready for up to 100 properties, 300 ledger transactions, 12 rent-roll rows and 120 maintenance jobs, each extendable by copying the last formula row down. The dashboard table shows the first ten properties and the tax summary splits across six columns.

I am not a spreadsheet person. Will I follow it?

The sample data exists for exactly that. Nothing is blank when you open it: you see a filled dashboard, a working rent roll and a real ledger, so you copy a pattern rather than invent one. Dropdowns mean you pick categories instead of mistyping them, and the Instructions sheet names the precise cells to delete.

Instant download. The ZIP is available immediately after checkout, with no expiry and no download limit. Personal-use licence: use it for your own portfolio and keep as many working copies as you like; reselling, redistributing, sharing the file publicly or re-templating it are not permitted.

This workbook is a record-keeping and organisational tool. It is not financial, legal or tax advice. Tax rules vary by country, state and situation - consult a qualified accountant or attorney about yours. All figures in the workbook and preview images are invented sample data, included so the formulas can be seen working. Nothing here is a projection or a guarantee of any return.

Microsoft and Excel are trademarks of Microsoft Corporation. Google and Google Sheets are trademarks of Google LLC. This product is an independent template and is not affiliated with, authorised by, or endorsed by Microsoft or Google.